
Wall watts are the only watts that exist
Three different 'wattages' circulate around every fixture: the marketing equivalence ('replaces 1000W HPS'), the LED arithmetic (number of diodes times their maximum rating — a ceiling no real fixture runs at), and the actual electrical input measured at the plug. Only the third is a fact about your unit on your shelf. It determines electricity cost exactly, tracks driver health over time, and is the number the maker's own specification sheet states as input power.
Measurement discipline is what makes readings comparable: LEDs and drivers shift as they warm, temperature-controlled fans add their own draw when they spin up, and dim settings obviously scale everything. Hence the protocol below — warmed up, full output, fan state noted — so that this month's number can be honestly compared with last month's, or with the seller's claim.
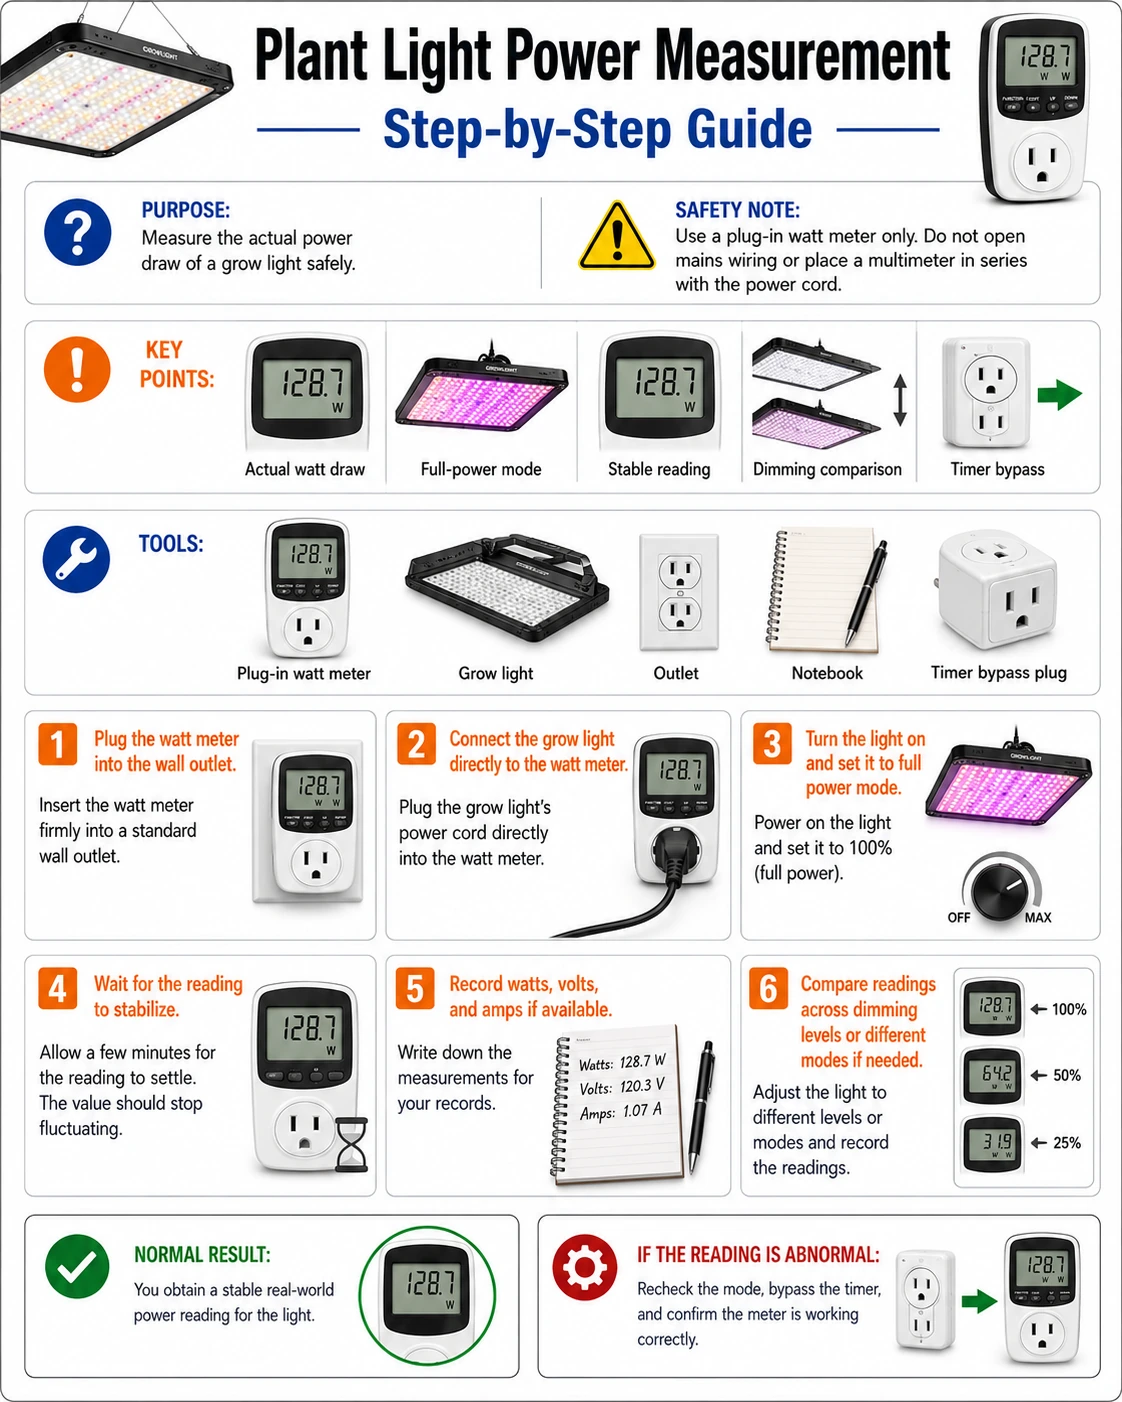
Prepare before testing
- Plug-in power meter — rated above the fixture's current; the entire lab in one socket-sized box
- The fixture's spec label or sheet — rated input power and input voltage range are the comparison anchors
- A notes app or paper table — per-channel, per-dim-level readings become a reference card for the room
- A clock — warm-up and kWh accumulation both need honest timekeeping
Check the meter's maximum load against the fixture's rating before plugging in, use a grounded outlet, and keep the meter's display out of the tent's humidity — it is house electronics, not grow-room electronics.
Check these areas first
- Verifying a purchase. listings inflate; the wall number confirms whether the fixture is what was paid for
- Budgeting electricity. kWh per photoperiod × tariff is the real monthly cost, computable to the cent
- Sizing circuits and gear. meters, timers, smart plugs and extension leads all carry ratings the fixture must fit under
- Watching driver health. a fixture drifting watts at the same settings over months is a driver aging or thermal problem announcing itself
- Comparing channels and dim levels. actual watts per channel combination beat the app's percentage labels for repeatable recipes
Diagnostic procedure
Anchor against the label, measure warm at full, then map channels and dim levels, catch the fan's contribution, and let the meter's kWh counter audit the schedule — five sessions of a minute each.
Read the label before the meter
From the fixture's plate or sheet, note rated input power (watts), input voltage range, and maximum current. Confirm the power meter's capacity exceeds them. These figures are the benchmark for every reading that follows — a measurement without the label next to it is a number without a meaning.
Measure at full output after real warm-up
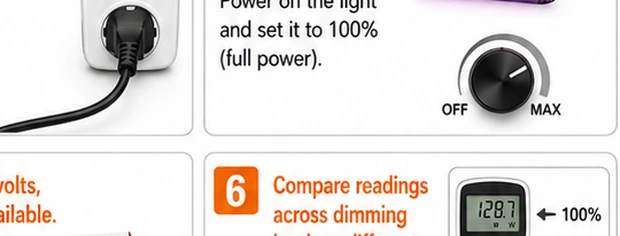
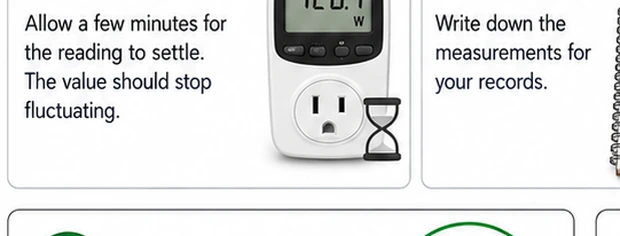
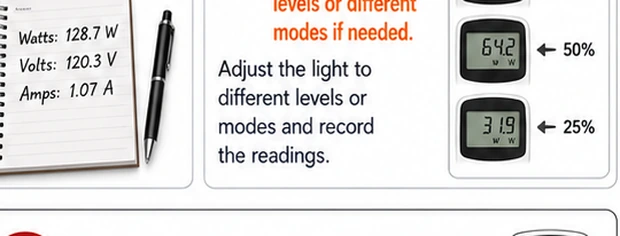
Meter inline, fixture at 100% on every channel, ten minutes of warm-up before reading. Record watts, volts, and power factor if shown. A healthy fixture lands near its rated input — commonly within ten percent. Grossly low readings mean a dim limit, a weak channel, or a listing that was never true.
Map the channels and dim levels
Repeat the stable-state reading at the combinations the room actually uses: each channel alone, the usual mixes, and 50/75/100% dim levels. The resulting table converts app percentages into real watts — useful both for recipes ('bloom mix = N watts') and for spotting a channel that draws suspiciously little.
Note the fan's on/off signature
On fixtures with temperature-triggered fans, watch the meter as the fan engages after warm-up: the extra draw is normally small but visible. Log both fan-off and fan-on figures so a future reading is not misread as drift when it merely caught the other fan state.
Accumulate kWh over a known runtime
Zero the meter's energy counter and let the fixture run its actual schedule for a known period — a day or a week. Energy used ÷ hours should equal the measured wattage; the same figure × the electricity tariff prices the photoperiod. Gaps between expected and accumulated kWh also expose silent shutdowns and timer faults.
Compare like with like when judging claims
Set the wall measurement against the rated input power only. 'Equivalent to' watts are marketing; diode-count arithmetic is a ceiling, not an operating point; and PPF/PPFD are light-output questions a power meter cannot answer. A fixture drawing its rated input is doing its electrical job — whether it delivers enough light to the canopy is the placement guide's territory.
The meter as a health monitor
The same protocol repeated quarterly turns the power meter into an early-warning system. Falling watts at identical settings and temperature usually means a driver derating from age or chronic heat — worth investigating before it becomes flicker or shutdowns. Rising watts at identical light output is rarer but real on failing drivers. Because each reading takes a minute against a written baseline, the habit costs nothing; the fault it catches early tends to be the driver, the one component whose warning signs are otherwise invisible until failure.
The boundary of the measurement
Input power says nothing about how efficiently a fixture turns watts into photons, or where those photons land. Two 200 W fixtures can differ by a third in usable canopy light depending on diode generation, optics and heat management. Wall watts anchor cost, authenticity and health; canopy questions need the placement grid and, ideally, a quantum meter. Keeping the two measurements in their lanes is what makes both of them trustworthy.